This article provides instructions on how to perform an RF system scan using the Televes H30+ Meter in a CATV environment. This feature is useful for verifying active channel presence and overall system health. 'System Scan' option allows the Televes H30+ Meter to highlight all active RF channels within a selected frequency plan. It also provides key performance metrics such as channel power levels, Carrier-to-Noise Ratio (C/N), Modulation Error Ratio (MER), and signal quality indicators—enabling quick identification of system performance issues, missing or degraded channels.
Ensure that your Televes H30+ Meter has been properly configured for Z-Band use. If not, please refer to the article: Initial Setup of a Televes H30+ Meter for a Z-Band System
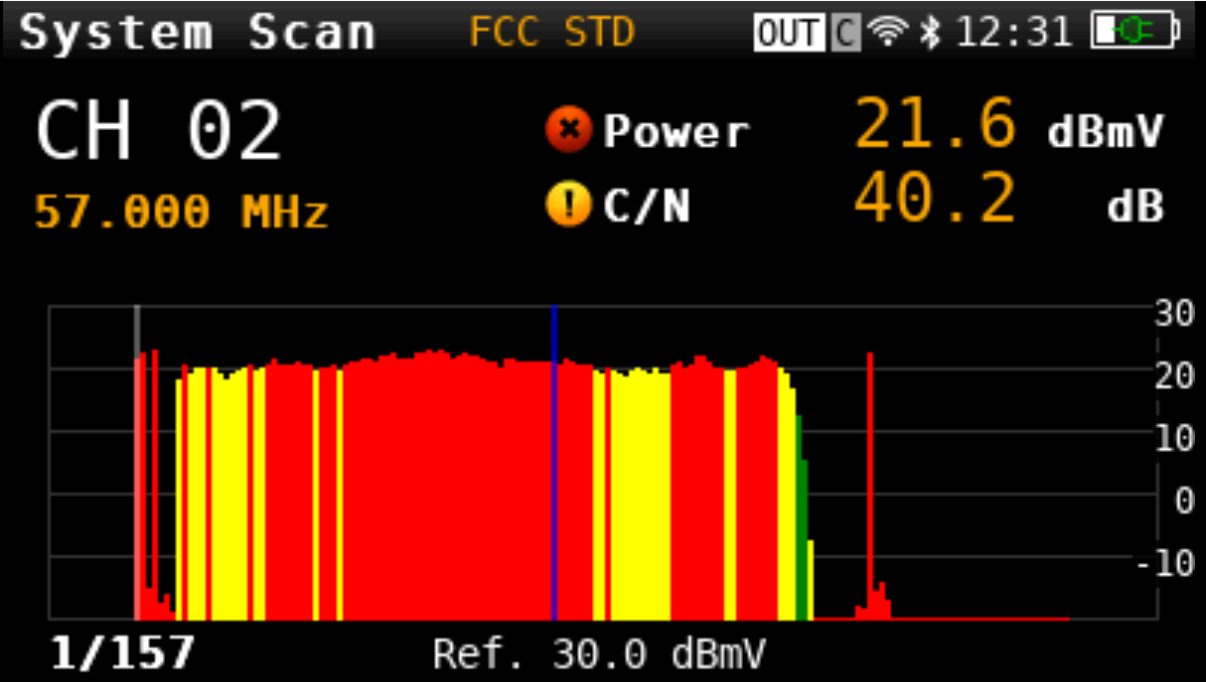
- From the "Home" screen, select System Scan and press OK. The duration of the scan may vary depending on the number of active channels in the system, typically ranging from 30 seconds to up to 4 minutes. The blue vertical line indicates the progress of the scan, as it scans all 157 channels or channels based off the learning plan selected.
- Below is an example of what you might see, but will vary depending on available RF channels at a site.
Understanding the Graph Interface
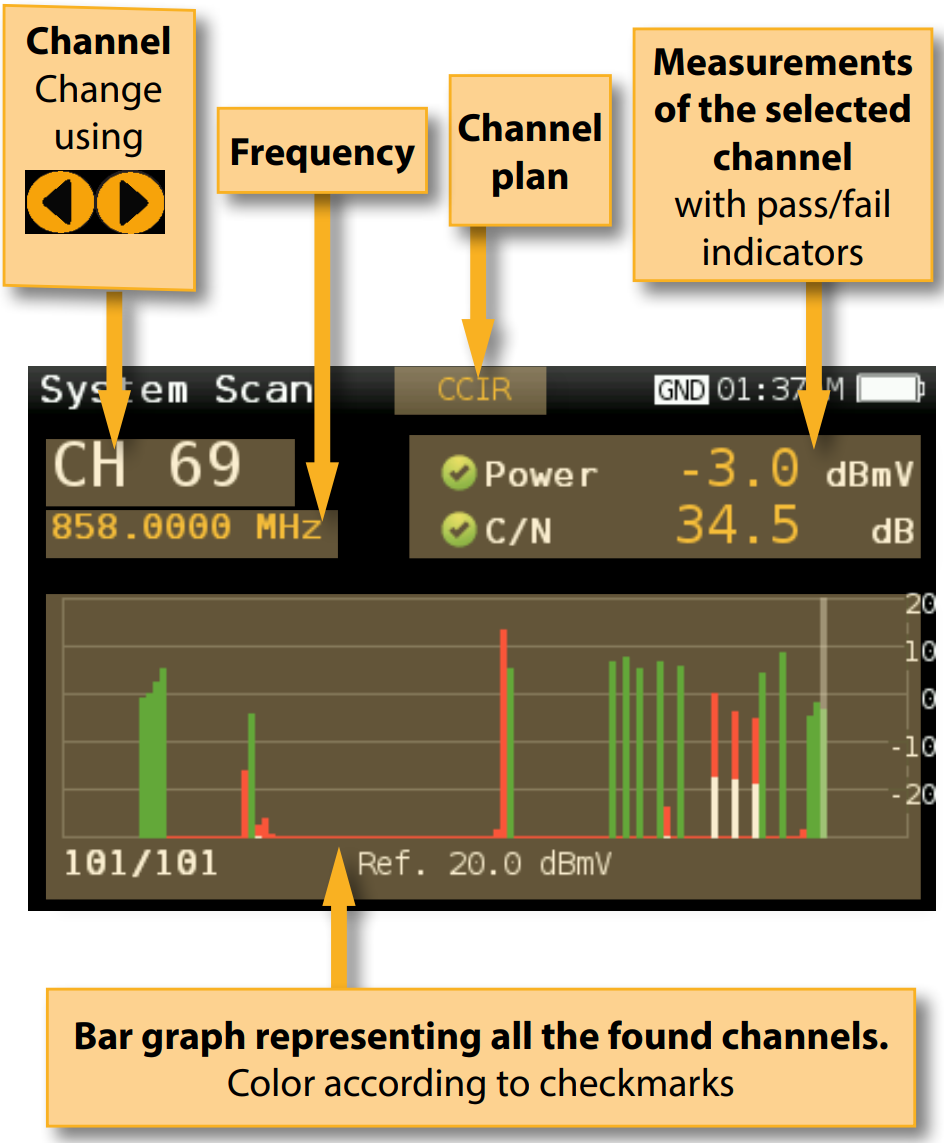 Image courtesy of Televes
Once the scan is complete, the screen will display a column chart / graph and a list of detected channels. You can scroll through the list of channels to view technical information for each channel, including:
- Power Level (dBmV)
- C/N (Carrier-to-Noise Ratio)
 Each of the columns are also color coded and the limits for each of the colors are defined by the Quality Profile setting. Refer to the article Add/View Quality Profiles to learn more.
Saving Scanned Data
 Ensure that the computer is on the same network as the meter.
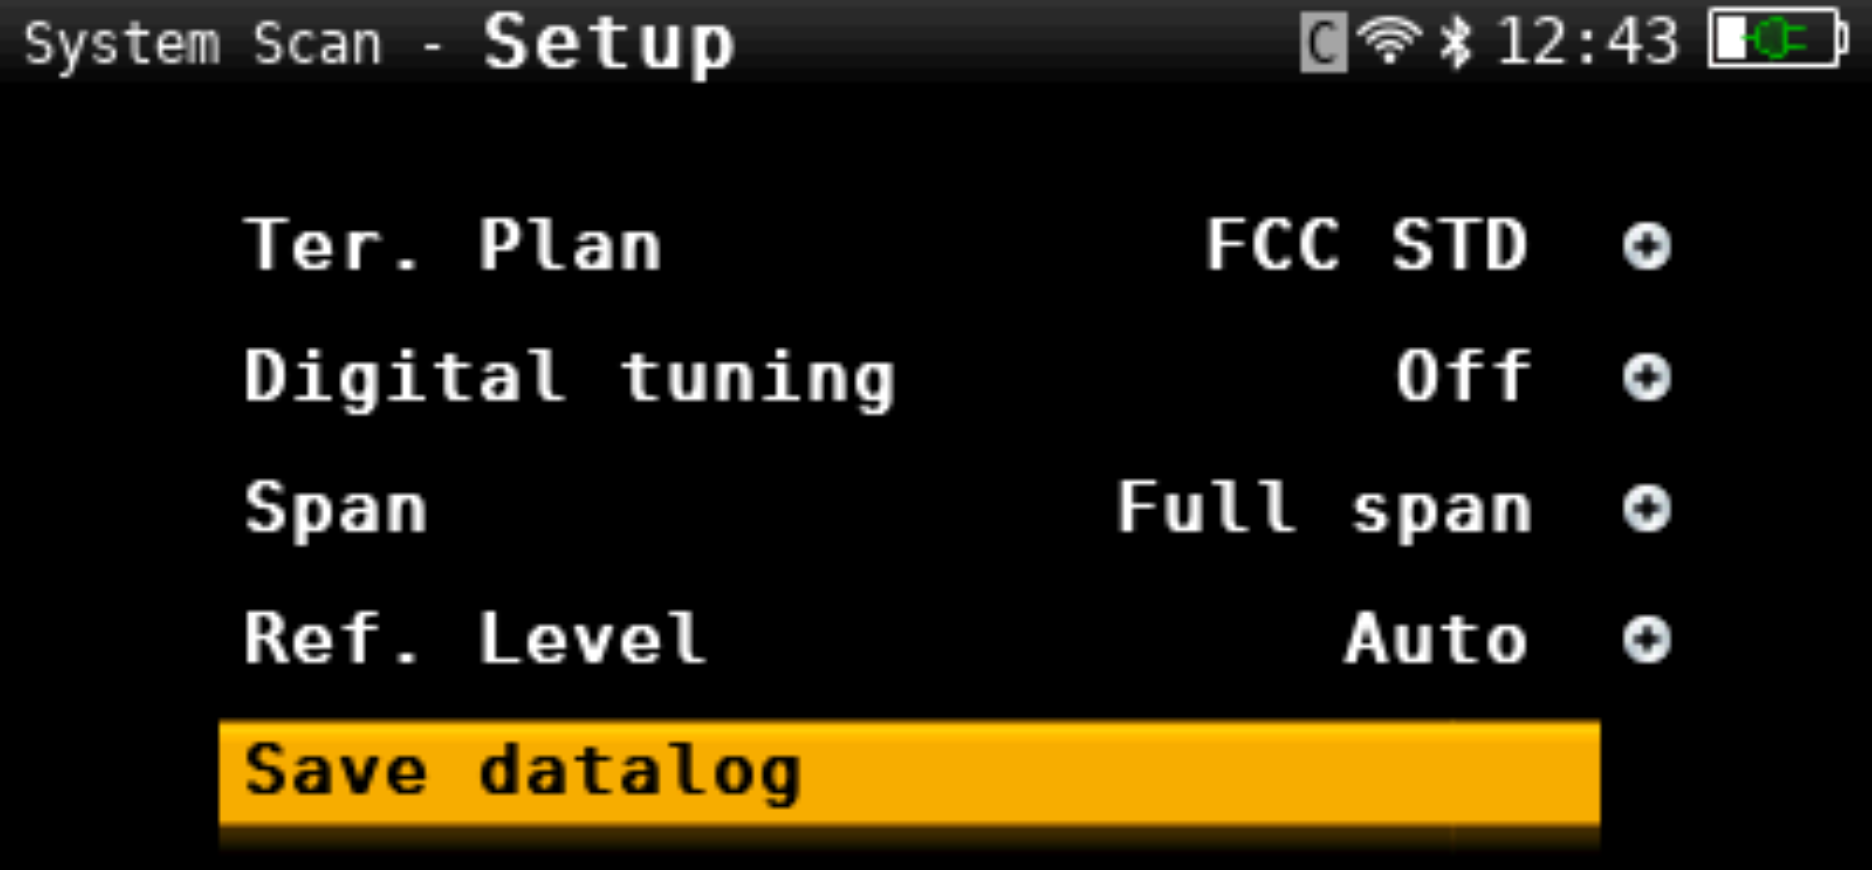
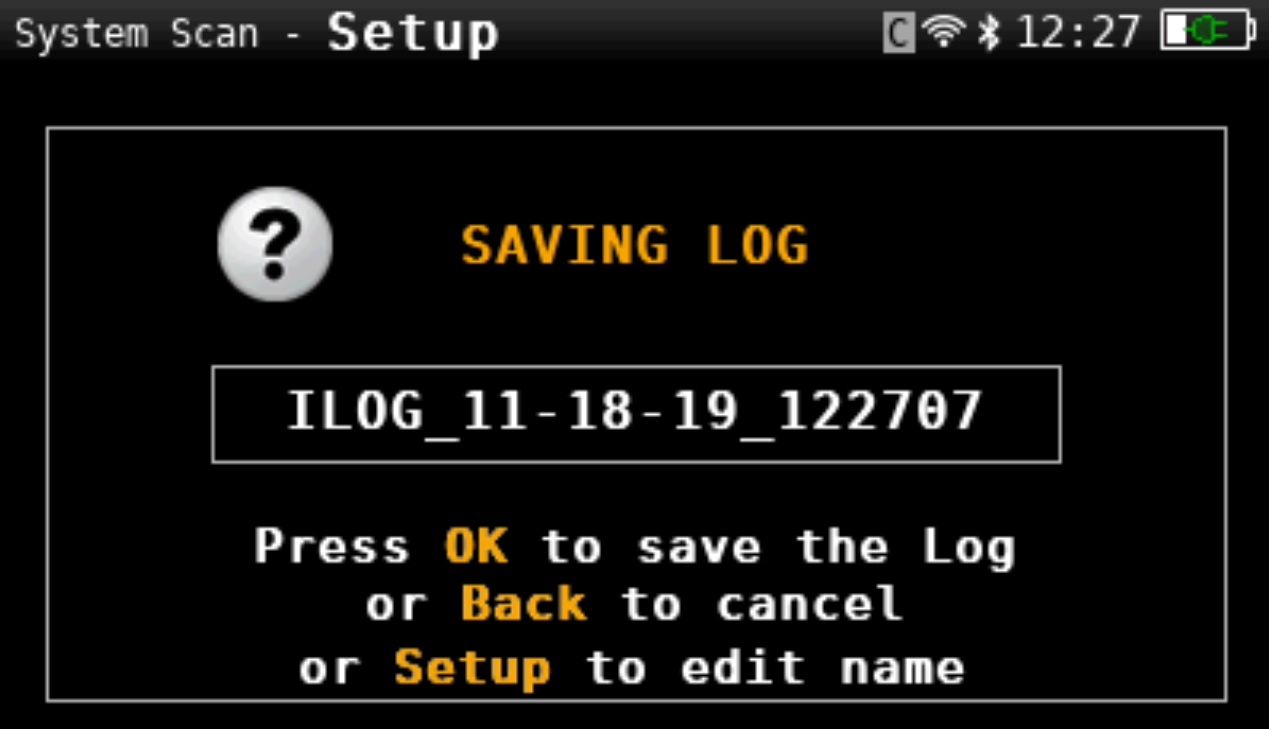
While in System scan mode, press the Settings (Gear) icon and select Save datalog option. Press OK to save the log with the default name, or select the settings/gear button again to rename the file to something more descriptive and relevant to your specific system or test location. The default name of the data log is date and time of the data capture and if the date/time are set incorrectly on the unit then the files names shown are also incorrect.
If using default file names ensure that the date/time settings are properly set on the unit.
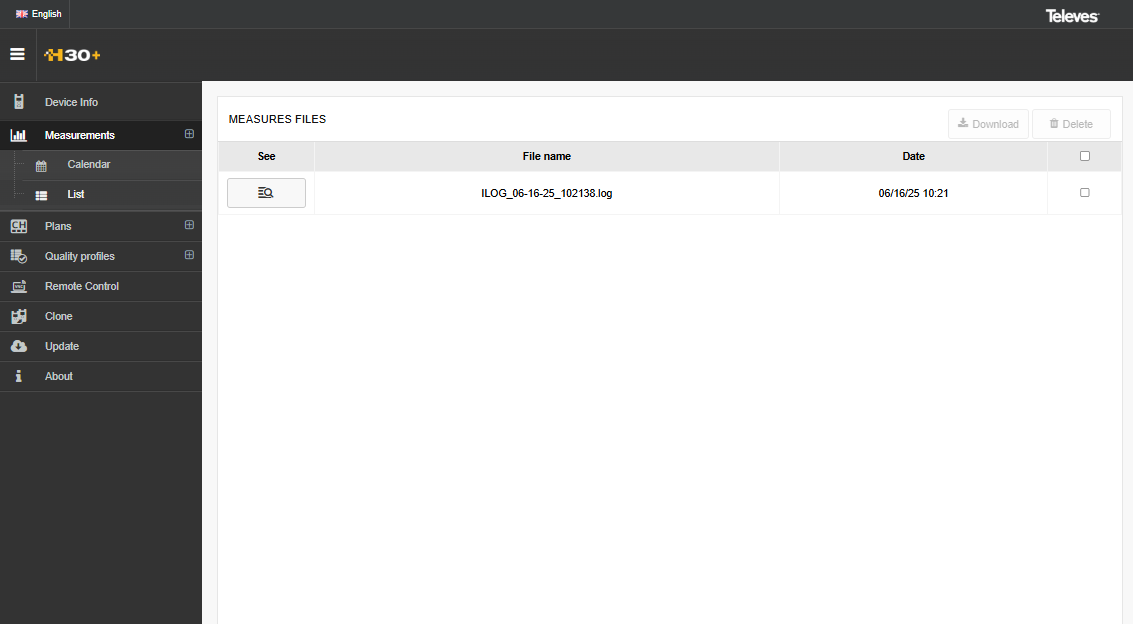
The saved data log will be stored locally on the unit, this data log can later be retrieved by connecting the meter to a network either via Wi-Fi or wired ethernet connection. On the computer where you want to access these data logs, open a web browser and type in the IP address of the meter. This should load the web-app for the Televes meter.
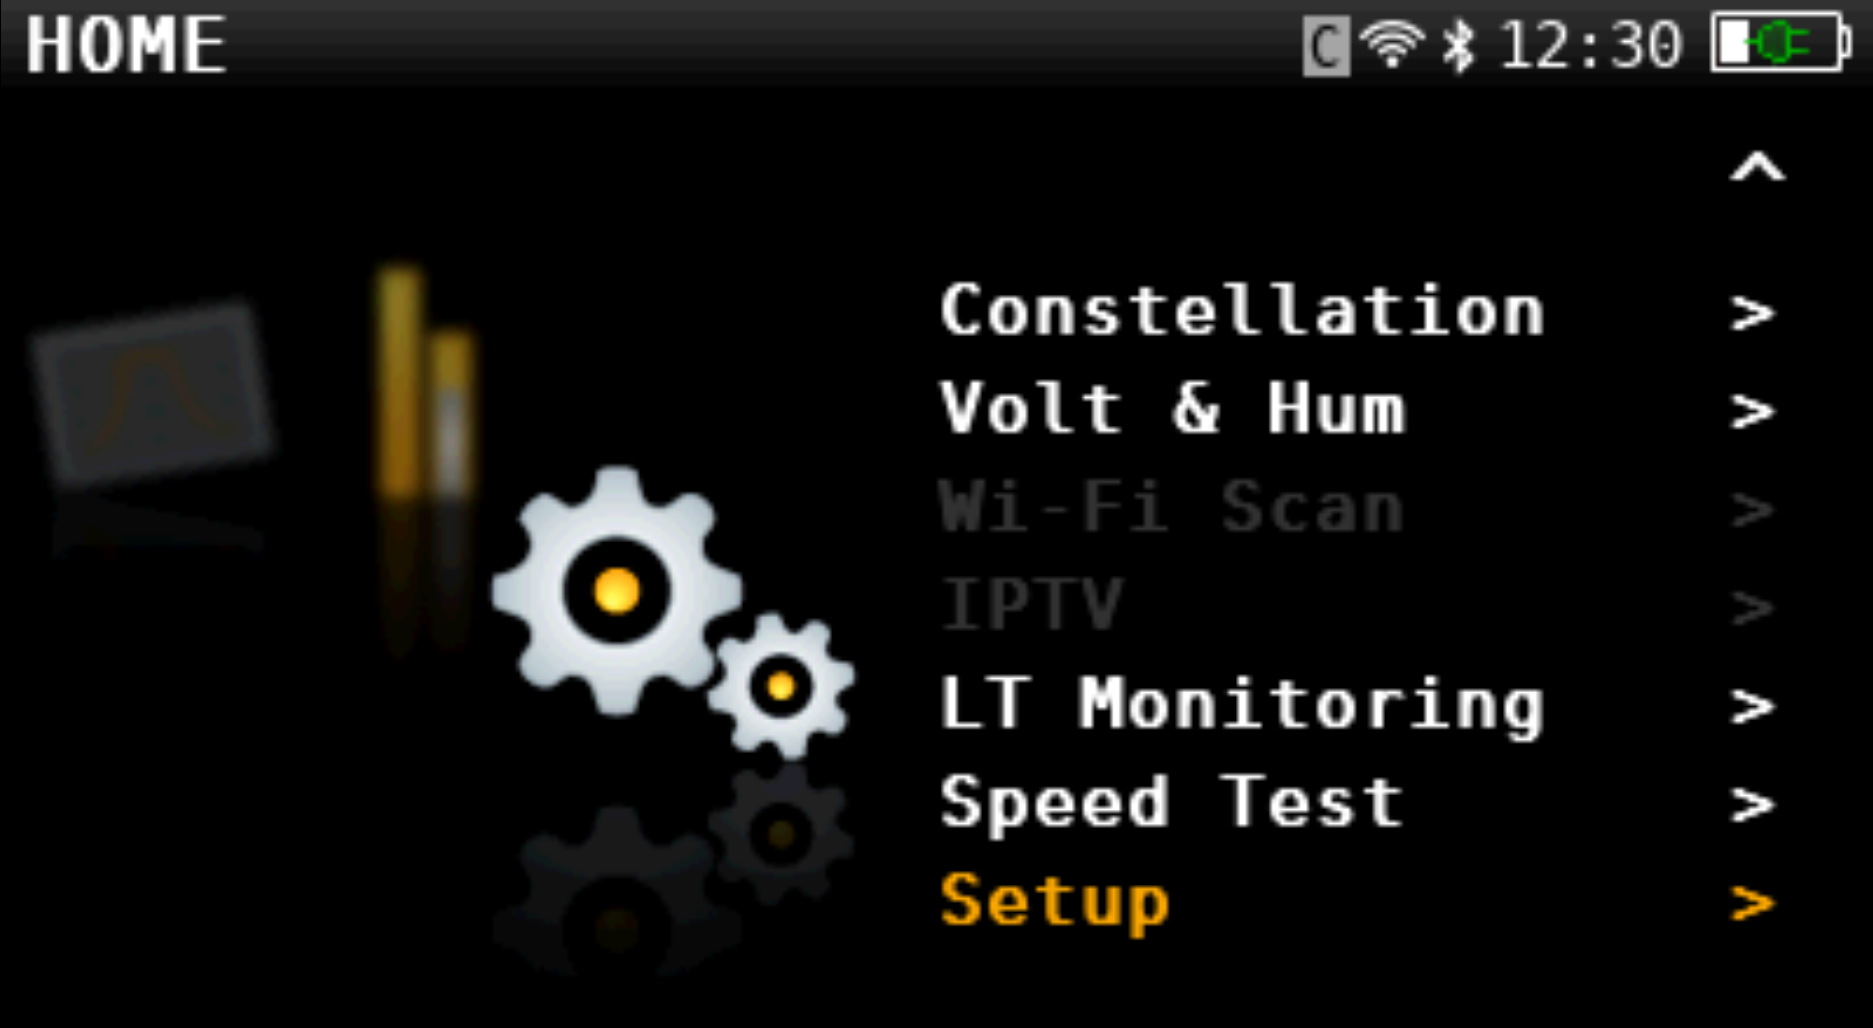
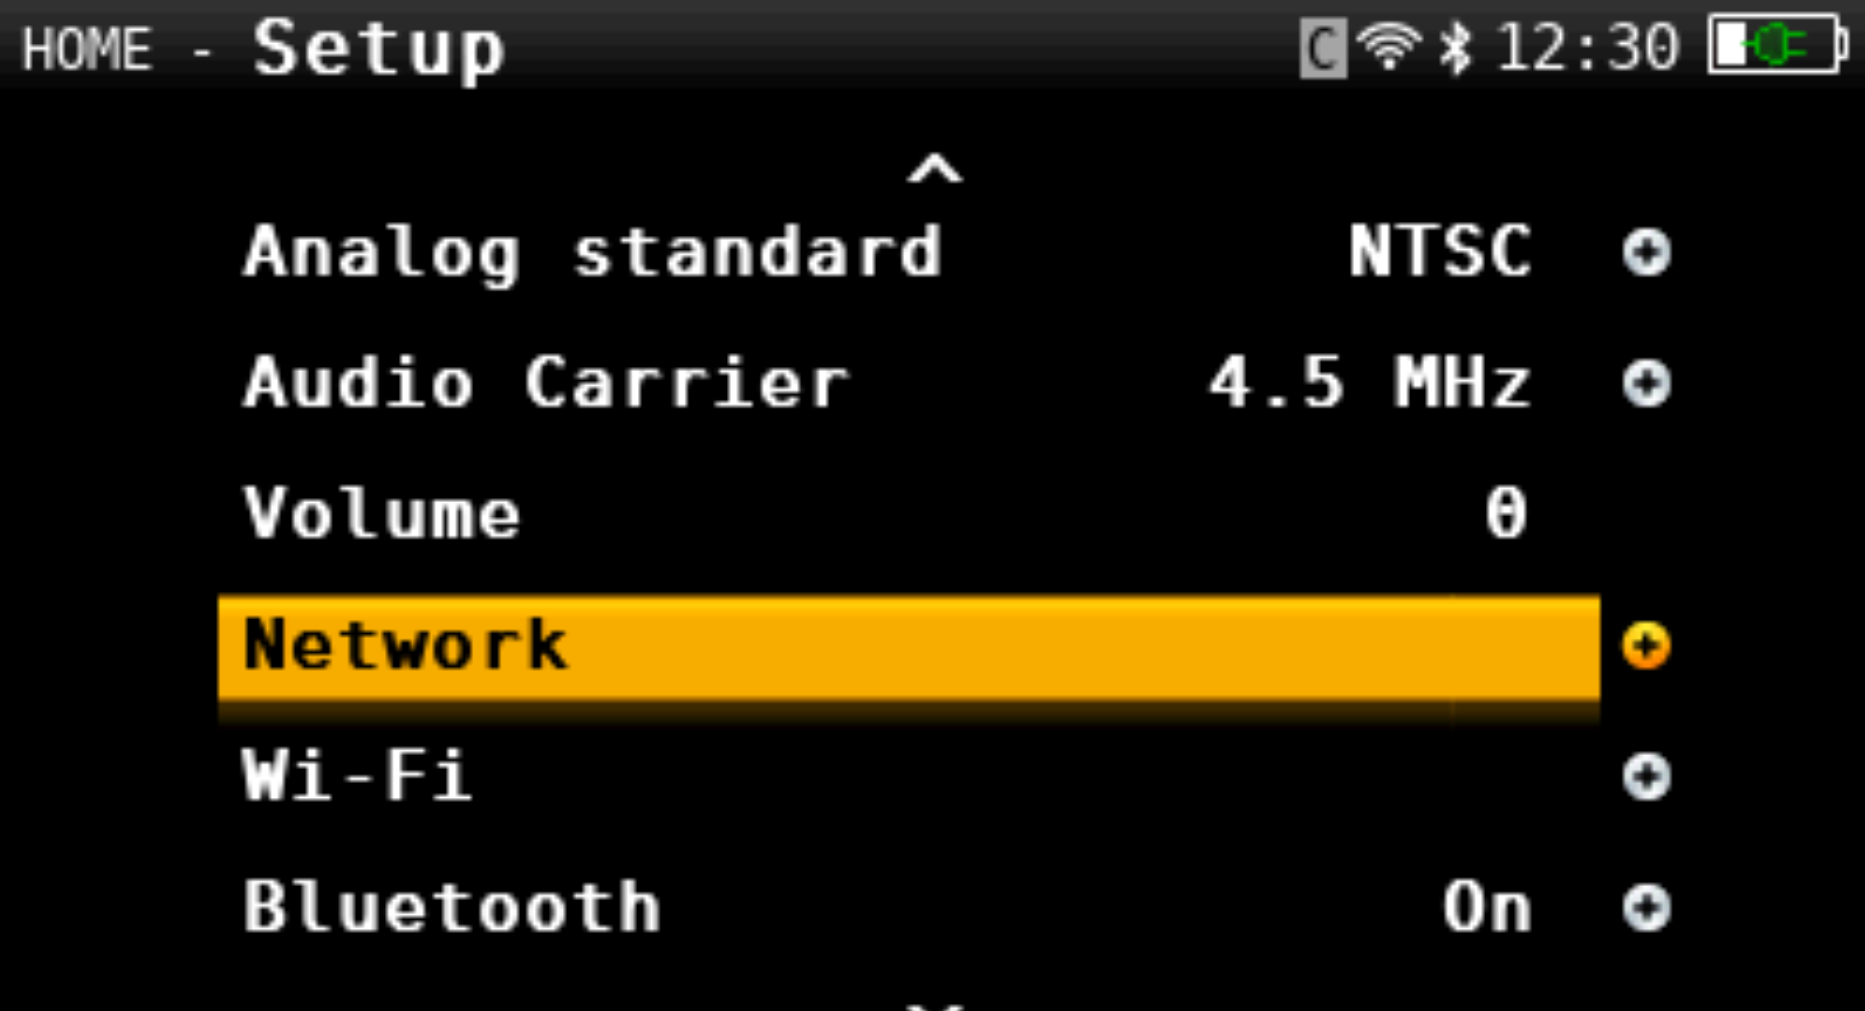
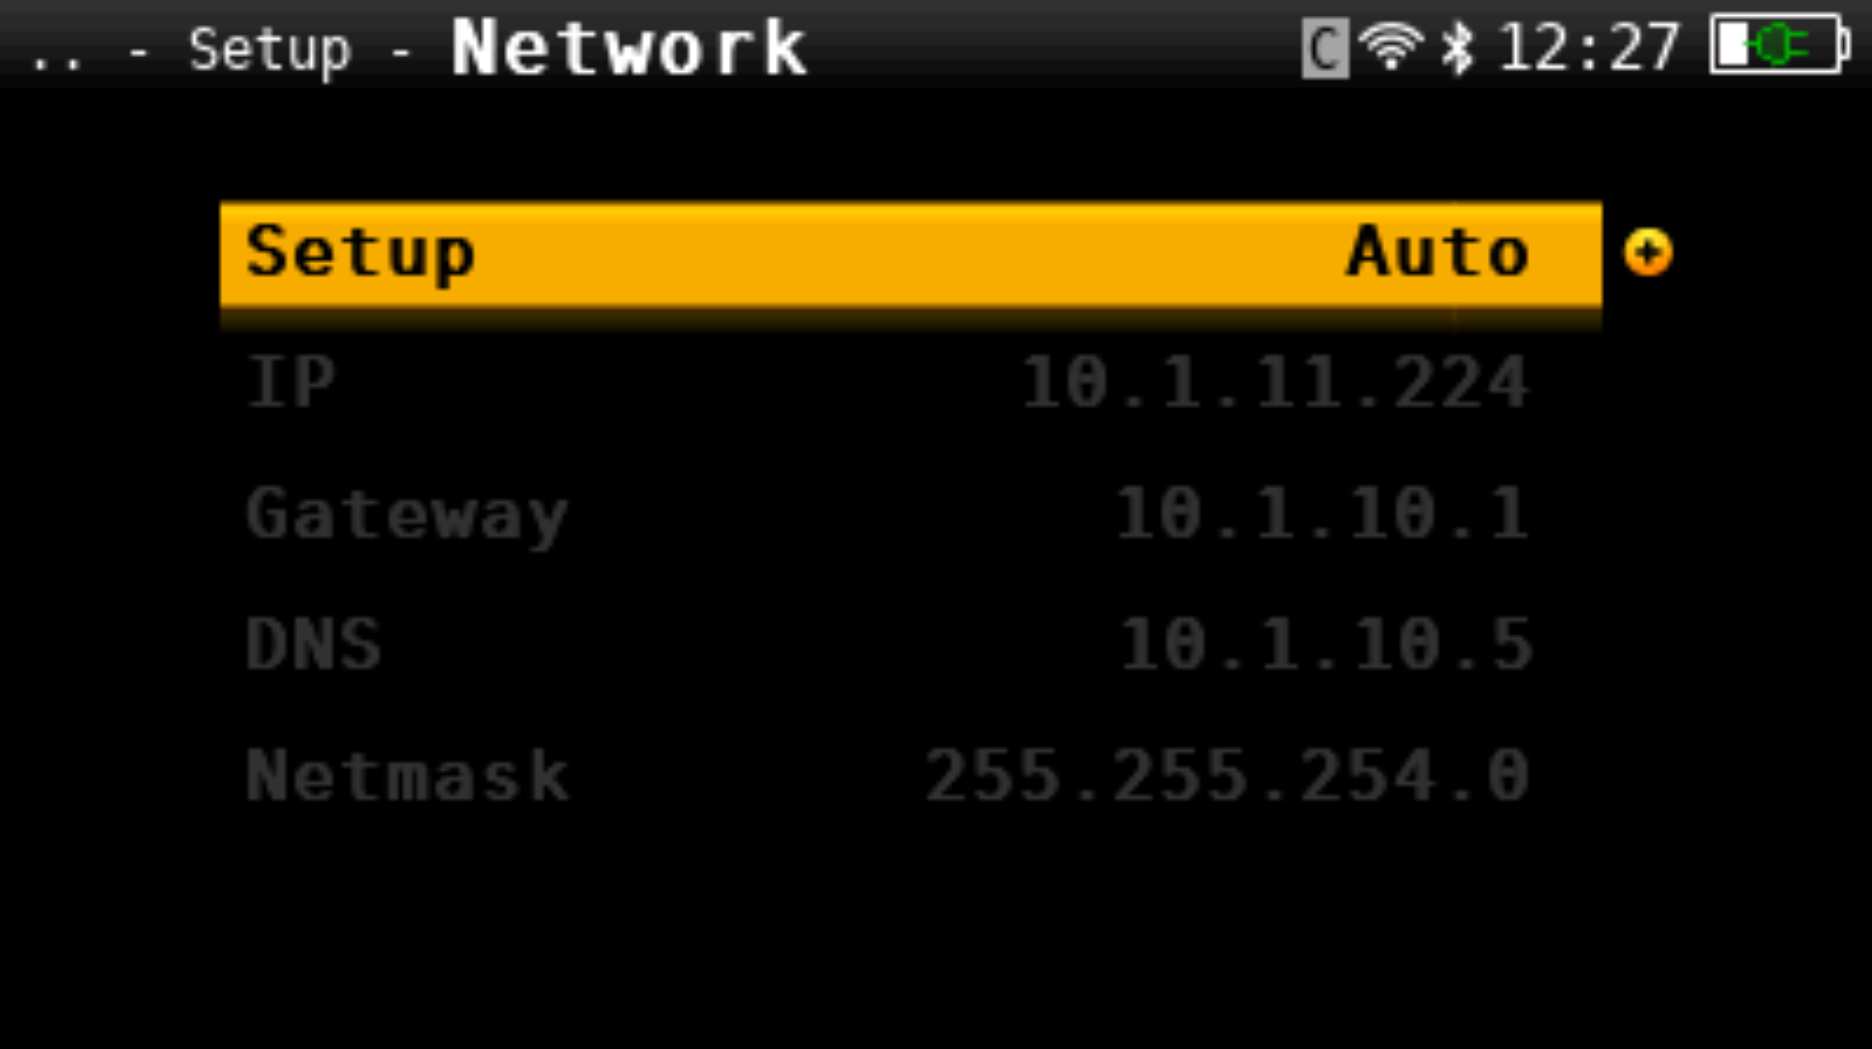
Ensure that the computer is on the same network as the meter.The meter's IP address can be found by navigating to "Setup" found at the bottom of the home screen. Then by selecting Network, the IP address will be displayed.
On the web app, the menu bar on the left has Measurements option. Navigate to the Measurements section and select List to view the saved data logs. To export the data, check the desired entry (check box) and click Download-an Excel (.xlsx) file will be generated containing the recorded measurement details.