Getting The Meter Ready
To read signal levels and other metrics pertaining to a single channel on the Televes H30 meter follow the instructions below
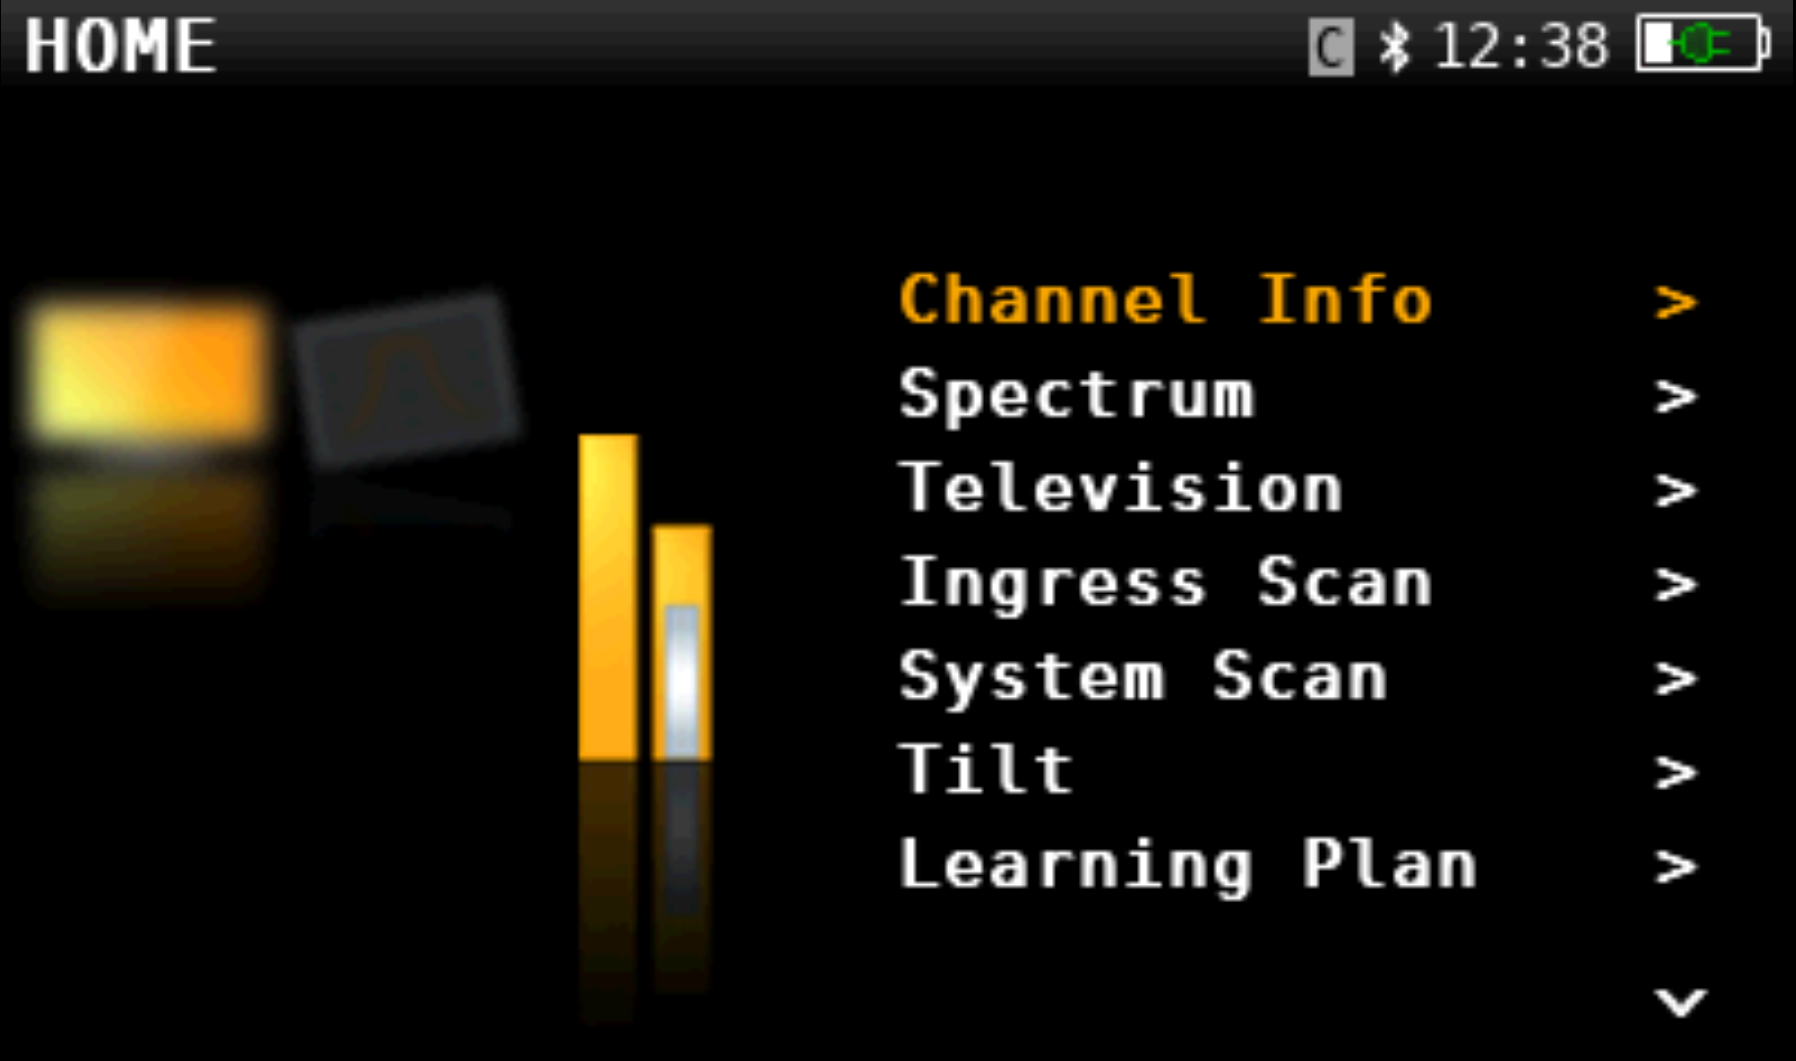
- From the Home page, go to Channel Info and press the OK button.
- Scroll to the desired RF channel that you want to view measurements for. For an H30 meter, use the center dial to change the channel and for an H30+ use the left and right arrow buttons to change the channel.
You are now on the individual channel information screen.
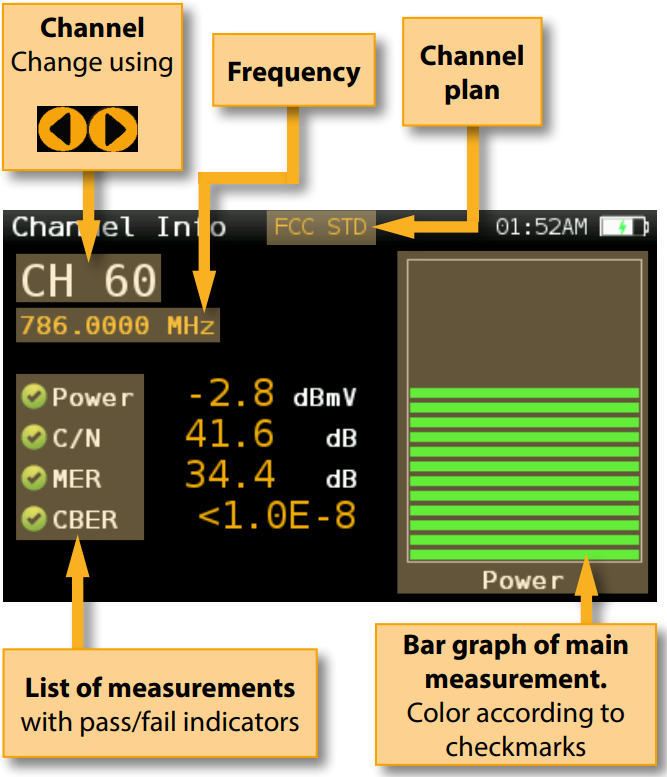 Image courtsey of Televes
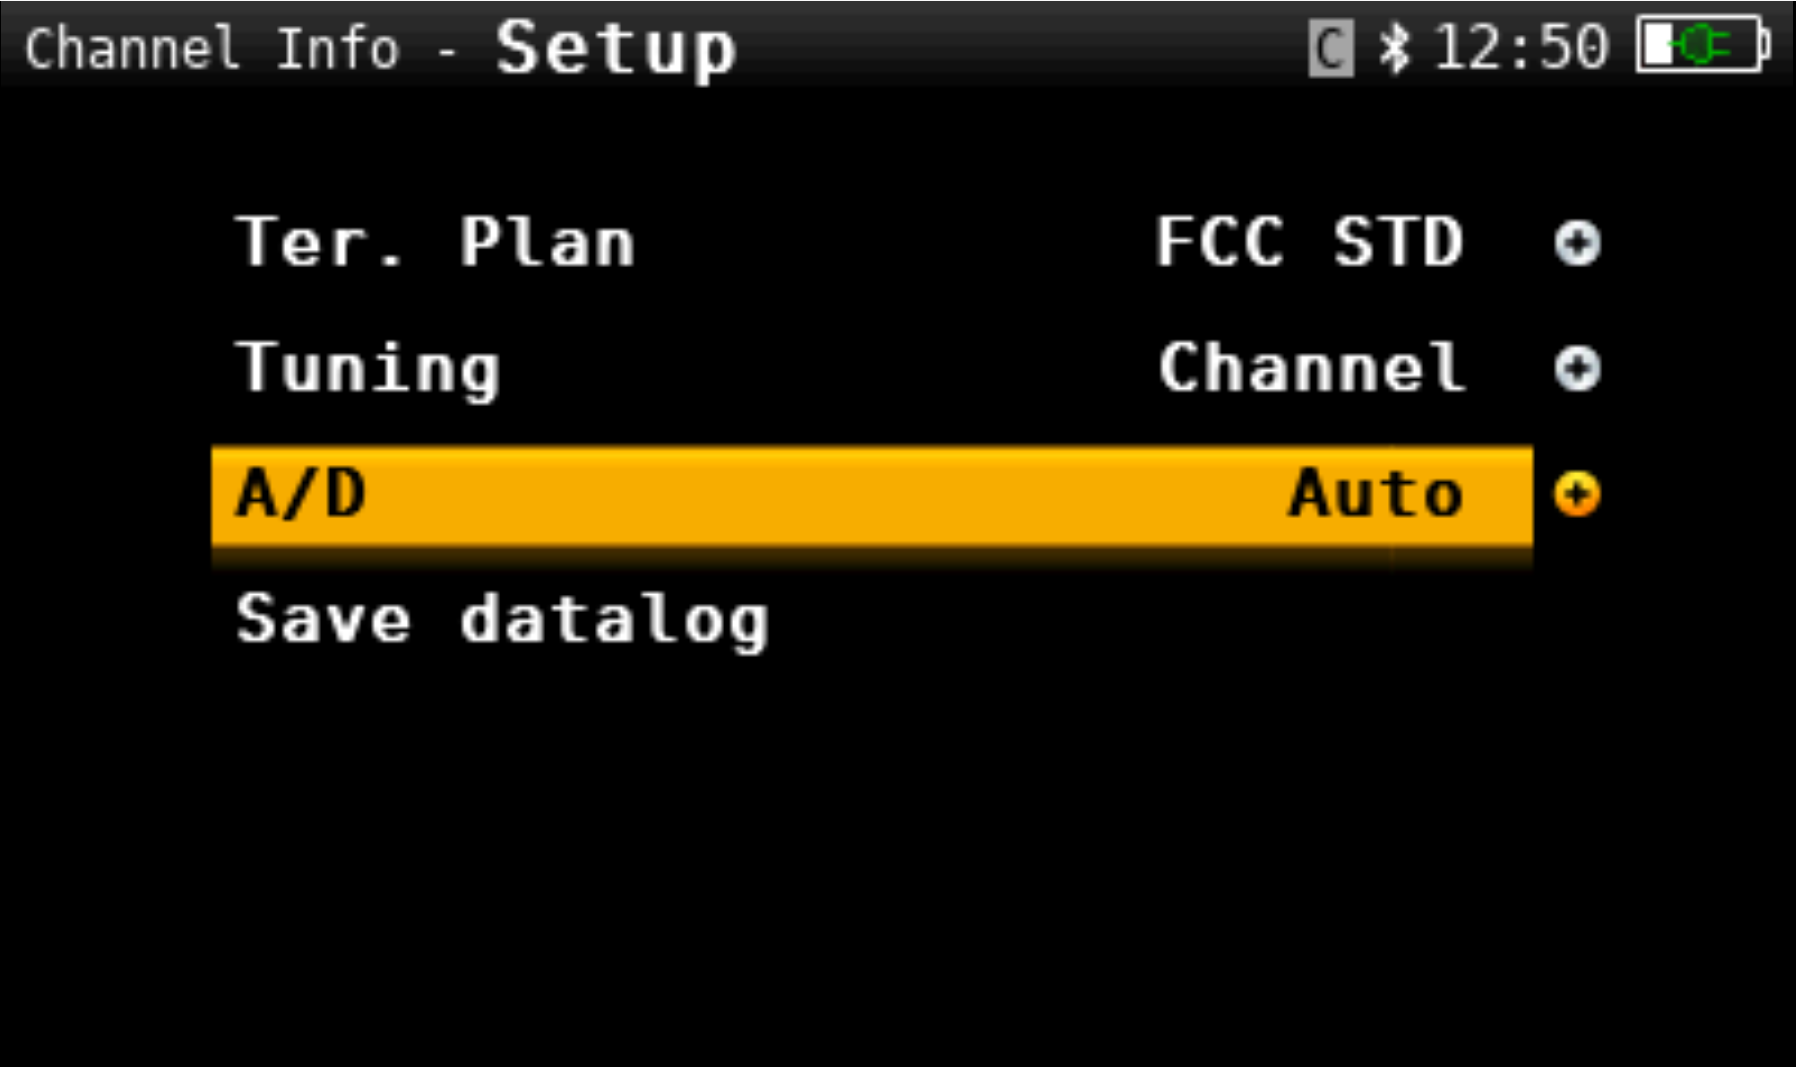
Signal Type Detection
By default, Televes H30+ automatically detects whether the signal is Digital or Analog and adjusts the measurements taken accordingly. If you wish to change this automatic detection feature, you can adjust the A/D setting to only detect Digital or Analog channels. This option can be accessed by pressing the settings/gear button when inside the Channel Info screen.
Understanding the measurements on Channel Info
The metrics presented by the meter are different depending on whether you are measuring an analog or a digital channel. The two sections below explain the metrics listed for both such cases.
Digital Channel Metrics (QAM/ ATSC)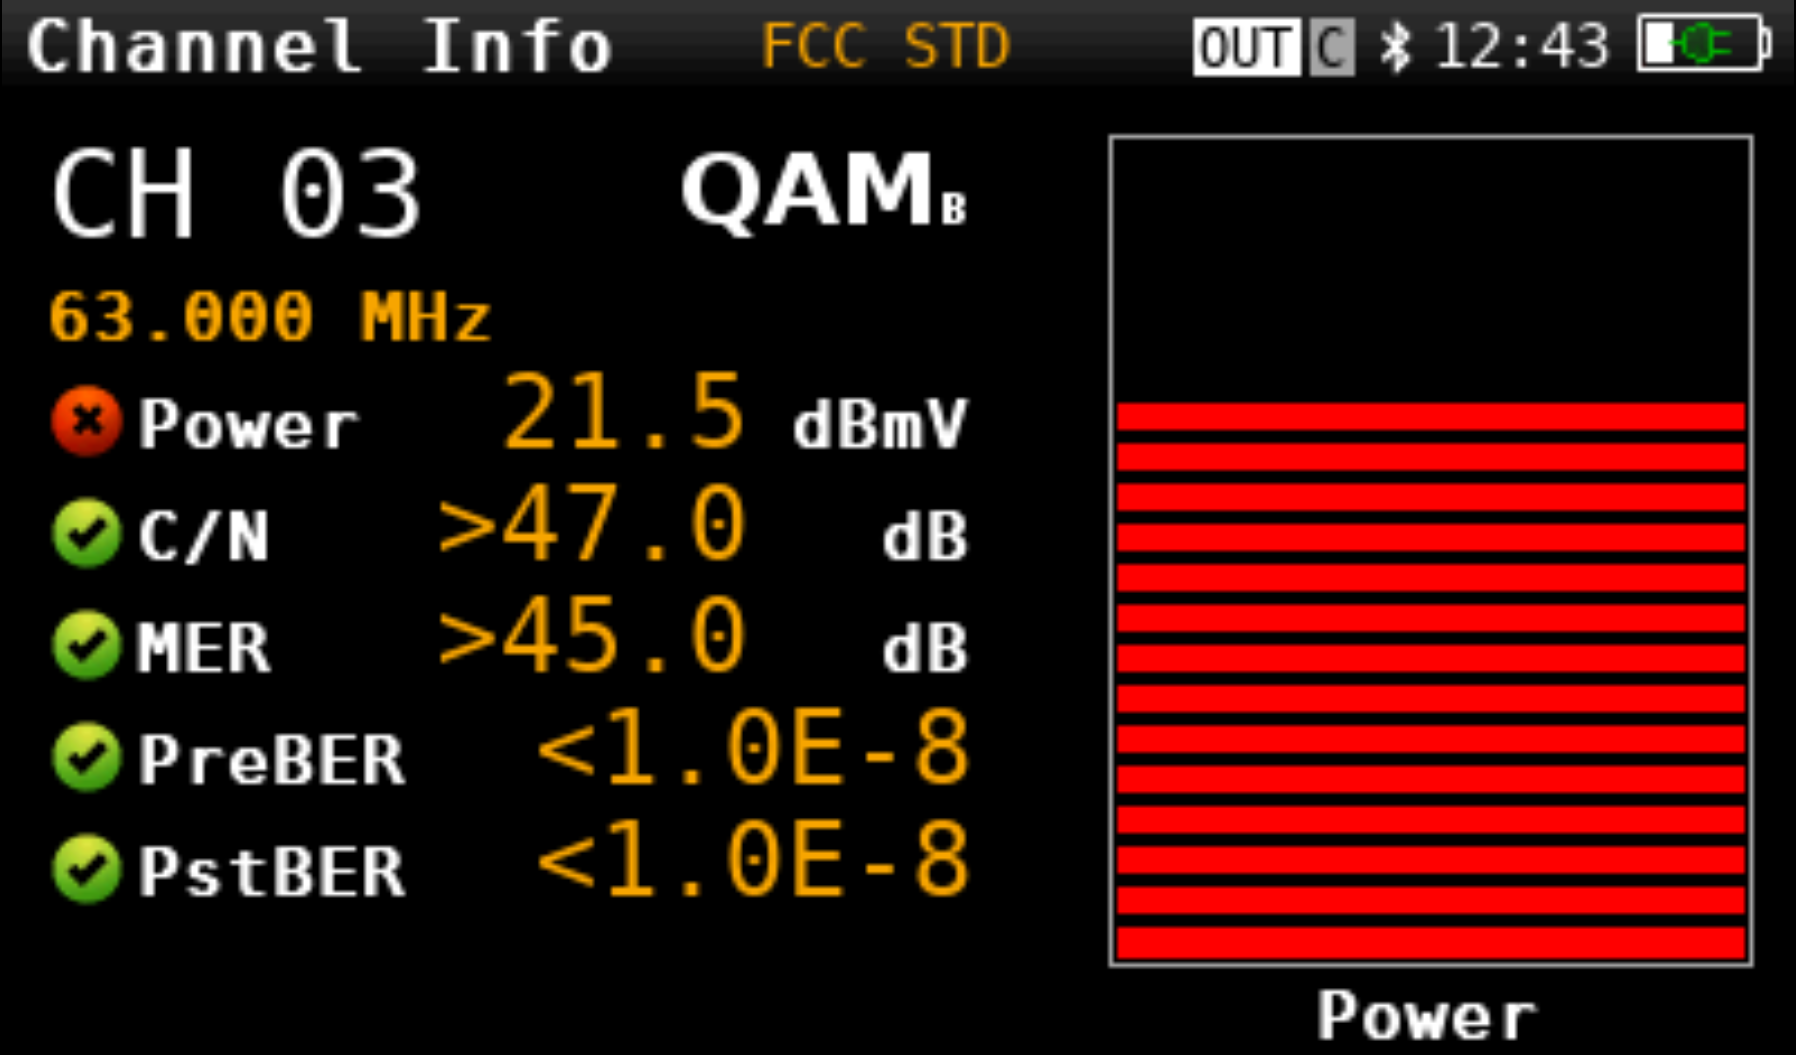
1. Power Level
Measures signal strength at the tuned frequency. These values are usually expressed in dBmV or dBuV and based on where the measurements are taken in the system the power levels tend to vary.
2. C/N - Carrier-to-Noise Ratio
Measures signal strength relative to noise. Higher values usually mean a cleaner signal but for digital channels the metrics like MER are even more useful in detecting other impairments due to phase noise or group delay.
- Acceptable: ≥35 dB
- Suspect: < 30 dB
3. MER - Modulation Error Ratio
MER indicates digital modulation quality. This is analogous to Signal-to-Noise ratio but is more specific to modulated signals. It is a ratio of average symbol power to the average error power. To put it in simple terms, imagine that you have a dart board where the center of the board represents a symbol in a constellation diagram. The closeness of the received symbol to the center of the board will determine the error in the modulation of this symbol. Closer the symbol is to the center target, lower the error. Hence higher the MER, the better.
- Ideal: ≥38 dB
- Acceptable: 31-37 dB
- Risk of pixelation or loss: <30 dB
4. PreBER - Channel Bit Error Rate
Shows pre-correction bit error rate. This number tells you how many bits are being received incorrectly out of the total.
Good Value: As close to zero as possible (<1.0E-4 or less)
5. PostBER - Channel Bit Error Rate
Shows post-correction bit error rate. This indicates how many bits still remain in error after applying forward error correction.
Good Value: As close to zero as possible ( <1.0E-9 or less)
Signal Level Graph (Bar Graph)
The vertical bar graph usually represents the Power level. This vertical bar is color-coded based on its value:
- Green: Signal is within acceptable range
- Yellow: Marginal performance - Caution
- Red: Signal is below acceptable threshold - likely an issue is present
Checkmarks next to parameters indicate a "pass" or "fail", colors will match the bar graph color.
The limits for each of the colors are defined by the Quality Profile setting. Refer to the article Add/View Quality Profiles to learn more.
Analog Channel Metrics (NTSC)
When tuned into an Analog RF channel, the following applies:
- No MER or BER readings (analog signals do not use digital modulation)
- Instead, you get a key parameter called V/A (Video-to-Audio Ratio).
- In analog mode you will still see Carrier-to-Noise Ratio (C/N)
The following are descriptions for each of the metrics shown on the channel info screen for analog channel:
1. Video
This is a measurement of RF power level of the analog video carried and is expressed in dBmV or dBuV.
2. Audio
This is a measurement of RF power level of the audio subcarrier which is typically offset at 4.5MHz off of the video carrier signal.
3. V/A
This is the ratio which indicates the difference in levels between video and audio carriers. Too high of a V/A ratio might result in audio being noisy and too low of a V/A ratio might impact the video quality.
4. C/N
Measures how far above the noise floor the analog video carrier signal sits. This is critical for analog signals as there is no error correction.
Ideal: > 43dB
Risk of noise/snowy picture: <35dB